Visual Analysis
Navigate:  Valuation > Analysis > Visual Analysis
Description
Visual Analysis is the interaction and display of an entire group of parcels as opposed to a single parcel. The functionality is not advanced analysis, but it lets you query and display a result set using dynamic layers.
The Visual Analysis legend supports the following data types:
- Numeric – Integer and floating point
- Year – checks if field name has year in it
- Date – only day, month and year are displayed and support internationalization
- String
Data Sources are not required and all standard variables are available in the Query Results columns and are used to configure ad hoc queries.
See GIS Control – Unified Map Viewer (UMV)
Steps
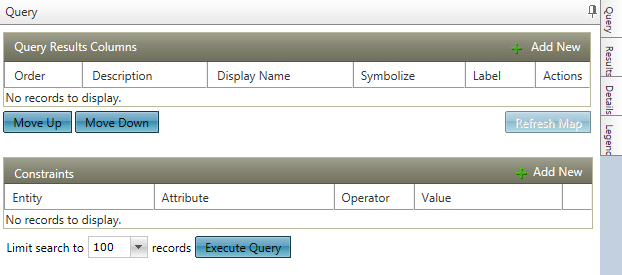
- On the Visual Analysis screen, click the Query tab on the right-hand side of the screen.
- In the Query Results Columns panel header, click Add Record to add a new result set column; the selected columns determine the query results that are returned.
- In the pop-up, select the checkbox for one or more items in the list and click Apply.
- Click Refresh Map. PINs that match your selected columns are highlighted in the GIS map.
- In the Constraints panel header, click Add Record. A new line is active for editing.
- Make a selection from the drop-down lists and click Execute Query. Results are displayed on the GIS map and in the Results side tab.
- Click the Excel icon to export the results to a Microsoft Excel worksheet.
- Click on any result in the list to view the PIN on the GIS map. The map zooms to display the selected PIN (results are highlighted).
- Click on any result in the list and click the Details tab to view the selected PIN's address and appraisal site summary information (e.g., land, buildings, features). This information is read-only.
- Click the Legend tab to view dynamically generated results based on the Query Results Columns information.
- Click Close to end the task.
NOTE: Use the Move Up and Move Down buttons to change the order of items in the panel.
OR