Reported Income
Navigate: Valuation > Property Characteristics > Real Property Search > [Next] > RPA Main Page > [Common Actions > Reported Income]
Description
Use the Reported Income task to track income and expense data, and reconstruct the data into operating statements to generate values using various methods of the income valuation approach. This process includes the tracking of income and expense data, and the valuation of those income streams.
The majority of information used in Reported Income is captured and tracked in an operating statement (also known as a Profit and Loss Statement). Once the operating statement has been reconstructed, it is used in the valuation process using various techniques (e.g. Direct & Yield Capitalization).
Steps
- On the Real Property Search screen, enter your search criteria and click Search.
- In the Results panel, select the checkbox for one or more items in the grid and click Next.
-
On the Reported Income screen, there are four tabs.
-
Make a selection from the Actions drop-down list in the Statements column.
-
Add New – A pop-up appears to add the new statement.
-
Select the Initial Template to be applied.
-
Make a selection from the Template to be Used drop-down list. Available templates depend on templates configured in Income configuration.
- Select the Create Individual Statements checkbox, if needed.
NOTE: When the checkbox is selected, you can enter multiple statements on the same Reported date without having all of the income and expense information compiled together once they get to the Direct cap and Yield cap tabs. Each statement will have a direct cap and yield value independent of the other statements.
Selecting this checkbox also displays the Reconciliation tab.
-
-
Enter or select the reported date. This is the effective date of the reported income and expense data. The reported date is used to determine which reported date group the individual income statement is included.
-
Enter an Operating Statement Title as a reference to the site or portion of the site represented by the income stream.
-
Click OK.
-
-
Copy – A pop-up appears to copy an existing statement.
-
Make a selection from the Operating Statement to be Copied drop-down list.
-
Select to Include Lease/Rental Breakdown and/or Include Lease /Rental Rates. When selected, lease and rental rates from the source operating statement are copied to the new operating statement.
-
If needed, select the Copy complete statement checkbox, which enables the Adjust holding period by 1 year and Recalculate DCF value checkbox.
-
Enter or select the reported date. This is the effective date of the reported income and expense data. The reported date is used to determine which reported date group the individual income statement is included.
-
Enter a New Operating Statement Title as a reference to the site or portion of the site represented by the income stream.
- Click Finish.
NOTE: You can also copy the complete statement without adjusting the holding period.
-
-
Delete – Deletes the selected statement.
-
Click Save under the Command Item bar.
-
Click View the Statement Report in the header area to open the report in a new window.
-
In the Statement Details column, the reported date and operating statement name are populated based on what you entered in the pop-up.
- If you are creating individual statements, make a selection from the Calculation Type and Collection Assignment drop-down lists.
-
In the Income Type and Sub-type column, make selections from the drop-down lists. Available sub-types depend on the Overall Income Type you selected.
-
In the Property Tenancy column, select any applicable checkboxes.
-
Optionally, click Add New in the Included Income Types and/or Available Space Data panel title bars and enter the necessary information. Click the green check mark to update the information, then click Save to retain your changes.
-
Click Save under the Command Item bar.
-
Click View the Statement Report to open the report in a new window.
-
Actual – The taxpayer's reported income; Actual Income is entered first.
- The Econ Rate column displays what is typical in the market place.
-
Reconstructed – The resulting interpretation of the Actual Income data after it has been normalized (reconstructed into operating statements).
-
Enter the actual income in the Operating Income panel for the selected statement.
-
Total Potential Gross Income – (optional) The highest level of income.
-
Gross Reported Income (override) – (optional) Typically, this is the actual income collected, which would already account for any vacancy and collection loss.
-
Vacancy Loss and Collection Loss (optional) – When values have been entered in the Total Potential Income and Gross Reported Income fields, Aumenum calculates the Vacancy Loss and Collection Loss values by subtracting it from the Total Potential Gross Income. This field can be edited.
-
Total Vacancy & Collection – When a Total Potential Gross Income value and a Vacancy Loss and Collection Loss value is present, Aumentum calculates a ratio representing the Total Vacancy & Collection as a percentage of the Total Potential Gross Income. This field can be edited.
-
Other Income – (optional) When a Total Potential Gross Income value and Other Income value is present, Aumentum calculates a ratio representing the Other Income as a percentage of the Total Potential Gross Income. This field can be edited.
-
Pass Throughs – (optional) When a Total Potential Gross Income value and Pass Through value is present, Aumentum calculates a ratio representing the Pass Through Income as a percentage of the Total Potential Gross Income. This field can be edited.
-
Effective Gross Income – Expressed mathematically, the Effective Gross Income = Potential Gross Income - Vacancy Loss and Collection Loss + Other Income + Pass Throughs. This field is read-only.
-
Enter expense values (by lump sum or by percentage of the Effective Gross Income) in the Actual and Reconstructed columns, as necessary.
-
Make a selection from the Category drop-down list for each expense entered in the Expense Breakdown panel. Available categories include seven system-managed categories, as well as user-defined categories:
-
General Operating Expense – A broad expense class that tracks all assigned expense categories as a single, general expense class. These are included in the expense calculation of the Net Operating Income (NOI).
-
Reserve for Replacements – Reserves are used to set aside funds over the economic life of the asset for its eventual replacement. These values are included in the expense calculation of the NOI.
-
Below the Line Expense – These expenses are not an allowable expense in direct capitalization valuation approaches, but may be used in the discounted cash flow approach. Below the Line Expenses are not included in the NOI calculation and are handled as a separate expense class after the NOI.
-
Misc. Variable – Expenses that vary based on the number of tenants in the building. For example, when an apartment building is vacant, there is still a need for management, utilities, and repairs, etc., but not at the same level that would be needed if the apartment building was full. The cost of these expenses tend to rise and fall based on the overall occupancy level (not necessarily in the same direction). Variable expenses are included in the expense calculation of the NOI.
-
Fixed Expenses – Expenses that do not vary based on the number of tenants in the building, or occupancy levels. Fixed Expenses are included in the expense calculation of the NOI.
-
Non-Allowable Expense – This is a general category indicating that the expense entered is not allowed for appraisal purposes. Non-Allowable Expenses are excluded from the NOI calculation.
-
Capital Expenditures – These expenses are not an allowable expense in direct capitalization valuation approaches since capital improvements to a property tend to increase the property's value; but they have the opposite effect on the cash flows, where applicable. Capital Expenditures can then be used in the discounted cash flow approach. Capital Expenditures are not included in the NOI calculation and are handled as a separate expense class after the NOI.
-
-
At the bottom of the screen, select a Validity Code for Actual and/or Reconstructed income that can be used in the Income analysis.
-
Click Save under the Command Item bar.
-
Click View the Statement Report to open the report in a new window.
-
Consolidated Operating Statement (default view) – Displays all income and expense information, summarized by reporting period. Each Consolidated statement represents summarized data from one or more individual operating statements, as of a specific Reported Date. This level of income is used by both the Yield and Direct Capitalization Approaches.
-
Individual Operating Statements – Each income statement defined for a reporting period represents a level of detail that is displayed as a separate column when the grid is expanded.
-
Make a selection from the Data View drop-down list.
-
Reported I&E – Displays the Actual reported income and expense data for each Reported Date.
-
Reconstructed I&E – Displays the Reconstructed income and expense data for each Reported Date.
-
Reported I&E Ratios – Displays the calculated ratios using the Actual reported income and expense data for each Reported Date. For levels of income or expense that do not have a calculated ratio, the value is displayed.
-
Reconstructed I&E Ratios – Displays the calculated ratios using the Reconstructed income and expense data for each Reported Date. For levels of income or expense that do not have a calculated ratio, the value is displayed.
-
-
Click the arrow next to any date in the grid to display individual operating statements associated with the Reported Date.
-
Optionally, click View the Statement Report to open the report in a new window.
-
Valuation Method – Specifies the type of Yield Capitalization technique/valuation method.
-
Terminal Rate Method – Specifies the capitalization rate development method to be used on the reversion.
-
Holding Period – Determines how many holding periods in years and how many columns are included in the Worksheet sub-tab.
-
In the Value Calculation Factors panel, manage the discount rate used against income streams for discounting, as well as the rates needed for the reversion calculation process.
-
Enter the Discount Rate manually or click the Tools icon to enter the Market Capitalization Rate in the pop-up.
-
If you select the Calculate Reversion checkbox, a reversion is included and the next two fields are active for editing.
-
Terminal Capitalization Rate – Can be entered manually or by clicking the Tools icon to enter the Market Capitalization Rate in the pop-up to create the discounted rate based on your selection in the Terminal Rate Method drop-down list.
-
Cost of Sale Percentage – The percentage rate applied to the capitalized reversion value to estimate the selling costs.
-
-
Add, edit, or delete adjustments in the Adjustment panel, which are applied against the Indicated Value of Cash Flows in the Discounted Cash Flow Summary panel. Adjustments are applied on the effective date, which is the same as the Reported Date of the statements.
-
In the Discounted Cash Flow Summary grid, you can export the information to a PDF file or Microsoft Excel worksheet. This summary is a read-only.
-
Present Value of Future Cash Flows – Displays the discounted value of all cash flows, excluding reversion over the holding period. Optionally expand the column to view each holding period of cash flows and the discounting factor applied, and the discounted present value of the cash flow. The holding periods are managed on the Worksheet sub-tab.
-
Present Value of Reversion (This row only displays when the Calculate Reversion checkbox is selected in the Value Calculation Factors column.) – Displays the discounted value of any reversion recovered at the end of the holding period.
-
Indicated Value of Cash Flows – Indicates the sum of the Present Value of Future Cash Flows and the present value of any Reversion.
-
Net Adjustments – Displays the net sum of adjustments made to the discounted value of the income streams.
-
Click Refresh as needed.
-
-
Click Save under the Command Item bar.
-
Optionally, click View the Statement Report to open the report in a new window.
-
Description – The description of the income or expense category.
Reconstruction – Populates the corresponding reconstructed income and expense data; this data represents Year 1 of the Discounted Cash Flow.
% – Displays the calculated statistics that represent the reconstructed income and expense data.
Years – The number of Year columns displayed depends upon your Holding Period selection (header panel). To create columns for all holding periods:
-
Click the green icon at the far right end of the row to open the Project Assistant pop-up.
-
Select a Projection Method.
-
Percentage of Previous Column – Starts from Year 1 Reconstructed value and applies a multiplier over each consecutive year, compounding the escalation rate.
-
Fixed Value – Applies a fixed value in each field for that row.
-
Percentage of Potential Gross Income – Applies the specified rate to each Year's Potential Gross Income (applies to Vacancy & Collection Loss, Miscellaneous Income and Pass Throughs only).
-
Keep First Year Percentage of PGI – Applies Year 1's calculated rate to each year's Potential Gross Income (applies to Vacancy & Collection Loss, Miscellaneous Income and Pass Throughs only).
-
Keep First Year Percentage of EGI – Applies Year 1's calculated rate to each year's Effective Gross Income (applies to General, Variable, Fixed Expense, Below the Line and Capital Expenditures categories).
-
Percent of Effective Gross Income – Applies the specified rate to each Year's Effective Gross Income.
-
-
Select the Projection Period.
-
All Periods – Applies the projection to all periods from Year 2 through the Reversion year.
-
Range From Starting Period to Ending Period
-
-
Click Apply & Calculate.
-
Reversion – This column only displays when the Calculate Reversion checkbox is selected in the Value Calculation Factors panel.
-
Optionally Export the worksheet to a PDF document or Microsoft Excel worksheet.
- Optionally, click View the Statement Report.
-
Define any Value Calculation Factors as applicable. Upon Save, these are displayed in the Direct Capitalization Summary panel.
-
Add, edit, or delete Adjustments to be applied against the Indicated value of cash flows.
-
In the Direct Capitalization Summary panel header, click the Pencil icon to edit or override certain Income and Expenses.
-
From the Direct Capitalization Summary grid, you can export the information to a PDF document or Microsoft Excel worksheet. The Direct Capitalization Summary is a read-only, calculated report displayed in the grid. Values in the grid are generated using the Reconstructed Income and selected Capitalization Rate from the Value Calculation Factor panel.
-
The information displayed in the Direct Capitalization Summary grid is summarized from all relevant Reconstructed Operating Statements for the Reported Date, by income level (Projected Gross Income, Gross Reported Income, Vacancy & Collection Loss, Pass Throughs, Effective Gross Income, Other Income and Net Operating Income), using only the Reconstructed Income and Expense data.
The grid also displays a calculation ratio and description, reflecting whether the sum of each income level is calculated as a percentage of Potential Gross Income, or Expected Gross Income (%).
-
Capitalization Rate – Used to capitalize the Net Operating Income into a value. The type of Capitalization Rate used is also displayed.
-
Capitalized Value – Is the value of the Consolidated income stream after it has been capitalized by the Capitalization Rate, but before rounding or Adjustments have been applied.
-
Net Adjustments – The net sum of all Adjustments made to the Capitalized Value.
-
Click Refresh to refresh the Direct Capitalization Summary grid.
-
- Neighborhood – From appraisal site
- Income Type – From Lease/Rental sub-tab in the Statement Maintenance tab; there may be multiple income types for each statement.
- Income Sub Type – From Lease/Rental sub-tab in the Statement Maintenance tab; may have multiple income sub types for each statement
- Rent Class – From the title page of the statement.
- Unit of Comparison – From Lease/Rental sub-tab in the Statement Maintenance tab; may have multiple units of comparison for each statement.
- Land – If By Object was selected when creating individual statements, land value is displayed.
- Excess land – If By Object was selected when creating individual statements, this is the total of the excess land value.
- Building – The sum of all buildings' value by object based on each selection of the Income method made.
- Features – The sum of any feature being valued.
- Adjustments – The sum of any adjustments made at the Direct Capitalization Value or the DCF value.
- Total – The running summary of all values for land, excess land, building, features, adjustments of the objects or value collection that has been selected via radio button for a given reported date.
- Unvalued objects – All objects not selected or included in any of the statements.
-
It will be either the Direct Capitalization Value or the Discounted Cash Flow (DCF) value using the various methods.
- You can see Direct capitalization and Yield capitalization and their corresponding valuation methods for determining the cap rates.
- Direct Capitalization – Market, Debt coverage Ratio, Mortgage equity
- Discounted Cash Flow – Market, Band of Investment
- For each method, the corresponding value already determined in the Direct Capitalization tab is displayed.
- For each method, the corresponding value determined in the Yield Capitalization tab is displayed.
- When there is a value and the radial button is selected, the bottom of the grid displays the summary.
-
Click Save to save the complete operating statement.
-
Click Advanced Search to return to the Real Property Search screen.
-
Click Close to end the task.
-
Statement Maintenance
View, add, and track combined reconstructed operating statements, or individual operating statements from this tab. These combined statements are then summarized into a single, consolidated operating statement, and used in the valuation process. The individual statements are linked either to an object or value collection and used in the valuation process.
Each column of data represents characteristics of an income stream reported for the appraisal site as of a specific reporting date.
Five sub-tabs are activated. In the Statements panel on the left side of the screen, click the down arrow next to a date to and click on a statement title to enter or view data for that Operating Statement.
Title
Lease/Rental Data
Create the unit/space composition and actual rents used to calculate a potential gross income.
Creating Lease/Rental Data is an optional task, but it lets you create the unit and space composition and actual rents used to calculate a potential gross income. You can track individual leases that are in place on the selected property.
Information added in Lease/Rental Data sub-tab is included in the Income Detail sub-tab and is part of the potential gross income calculation process for the Direct cap and Yield cap valuation.
OR
Click the Pencil icon for an item in either grid to edit the information.
All fields in the Included Income Types panel, except Eff. Year of Income, will auto-populate based on information entered on the Title sub-tab. All fields can be edited.
Income Detail
The Income Detail sub-tab displays a basic list of commonly used income categories that are used to calculate an estimated Effective Gross Income, including:
NOTE: Click the +R icon in the panel's title bar to copy all values entered or edited in the Actual fields to the Reconstructed fields.
NOTE: Ensure Other Income and Pass Through values are not included in the Gross Reported Income you enter.
Expense Detail
Track operating expenses charged against the income stream for goods and services necessary to support that stream.
NOTE: Income Configuration is a prerequisite to the task; the information configured in Income Configuration represents the expense categories displayed in the Expense Detail sub-tab. These categories are assigned to expense classes that determine which business rules are applied by Aumentum and how the expenses are used in the valuation and analysis process.
NOTE: Click the +R icon in the panel's title bar to copy all values entered or edited in the Actual column to the Reconstructed column. When the Actual and Reconstructed income values are not the same, you can make a selection from the Adj. Reason drop-down list to explain why the values differ.
Notes
Add, view, or edit notes specific to the operating statement. Notes use standard Aumentum functionality.
Statement Summary
The Statement Summary tab displays the income and expense data summarized by income level; by default, the consolidated income stream is displayed at the appraisal site level.
Two levels of detail are displayed in the columns of the Operating Statements on File panel:
NOTE: The calculations are identical to those defined for Reported I&E Ratios, but are performed using Reconstructed data rather than Reported.
Yield Capitalization
Calculate and manage values using in the Yield Capitalization tab.
After combined operating statements have been reconstructed and summarized into a Consolidated Operating Statement, they are used as the initial year of income and expense data for the Yield Capitalization approach.
Using the Individual operating statements, each statement will have separate Yield cap values within the same Reported Date.
The Yield Capitalization tab contains a header bar with three drop-down lists:
Yield Capitalization contains three sub-tabs.
Summary
The Summary sub-tab includes three panels of information.
NOTE: The Rate Development Method displayed in the pop-up is dependent upon your selection in the Valuation Method drop-down list.
Worksheet
Use the DCF Income Statement panel to project what the anticipated income and expenses for the property will be going forward, over the duration of the holding periods. All values must be entered by period for all relevant income and expense records.
Worksheet Columns:
Worksheet Rows:
The breakdown and display of individual potential gross income amounts are dependent upon the number and types of income entered on the various Reconstructed Operating Statements.
NOTE: Each Lease/Rental Income value is tracked as a separate record for projection purposes. This portion of the worksheet varies from appraisal site to appraisal site, and potentially, from year to year within an appraisal site.
Notes
Add, view, or edit existing notes specific to the Yield Capitalization process from the Notes sub-tab, which uses standard Aumentum Notes functionality.
Direct Capitalization
Reconstructed data from the Consolidated Operating Statement is used as the income and expense data for all Direct Capitalization valuation methods.
Make a selection from the Valuation Method drop-down list, which specifies the type of Direct Capitalization technique/valuation method.
There are two sub-tabs.
Summary
View and maintain income and expense assumptions, as well as the capitalization rate and adjustments needed to calculate the final value.
Notes
Add, view, or edit existing notes specific to the Direct Capitalization process from the Notes sub-tab, which uses standard Aumentum Notes functionality.
Reconciliation Summary
NOTE: This tab appears only if you selected the Create Individual Statements checkbox when adding or copying a statement. This information is read only.
The Reconciliation Summary sub-tab displays the Income type and sub type of an individual statement. You can create multiple individual statements and, when selecting this tab, it will display the corresponding Income type/sub type of the statement selected in the Title or the Lease/Rental sub-tabs in the Statement Maintenance tab.
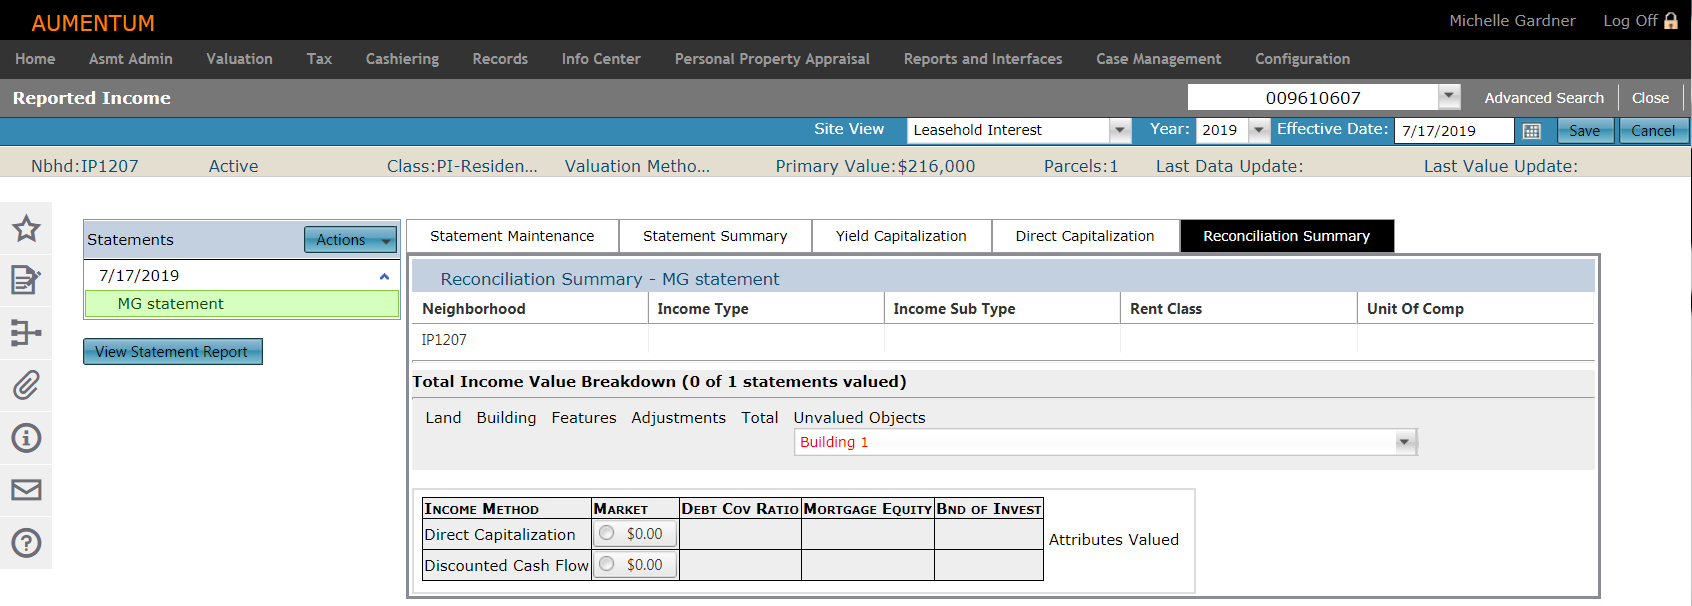
The Total Income Value Breakdown panel shows the running summary total of either all objects or value collections for the statement.
In the Attributes Valued panel:
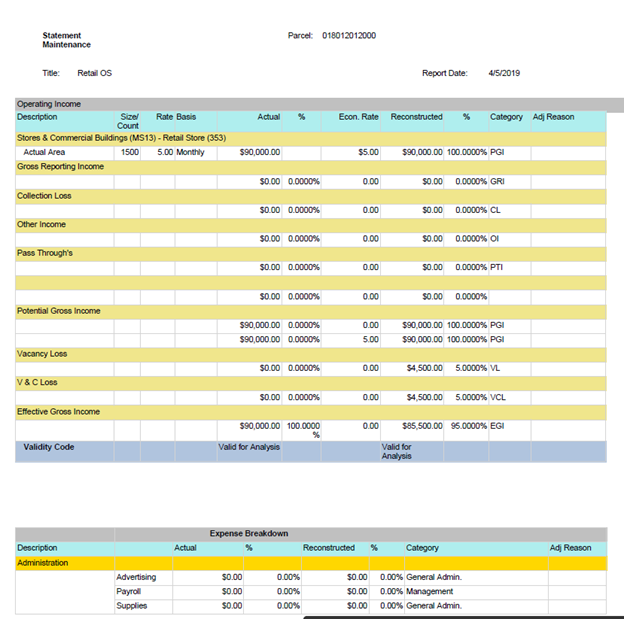
Report Samples
Statement Report