Sales Ratio Analysis
Navigate:  Valuation > Analysis >
Sales Ratio Analysis
Valuation > Analysis >
Sales Ratio Analysis
Description
Sales Ratio Analysis is designed to evaluate appraisal performance. You can select an existing study group and perform basic statistical analysis on it to compare current value results with the sales prices existing within the selected study group. The analysis is powered using Aumentum batch processing capabilities and the resulting data persists in temporary tables so that it can be reviewed at a later time.
There are two major aspects of appraisal accuracy: level and uniformity. Appraisal level refers to the overall ratio of appraised values to market values. Level measurements provide information about the degree to which goals or certain legal requirements are met. Uniformity refers to the degree to which properties are appraised at equal percentages of market value.
The Sales Ratio Analysis task does not alter any data associated with the sales or associated appraisal sites and revenue objects. Combined with the Sales Ratio Report, you can analyze various valuation methods with sales information as a means of determining the statistical accuracy with which the values approximate the valid market prices contained in the study group.
Once an analysis group is created and stored, you can retrieve sales ratio groups using the Aumentum Sales Ratio Analysis feature.
Steps
-
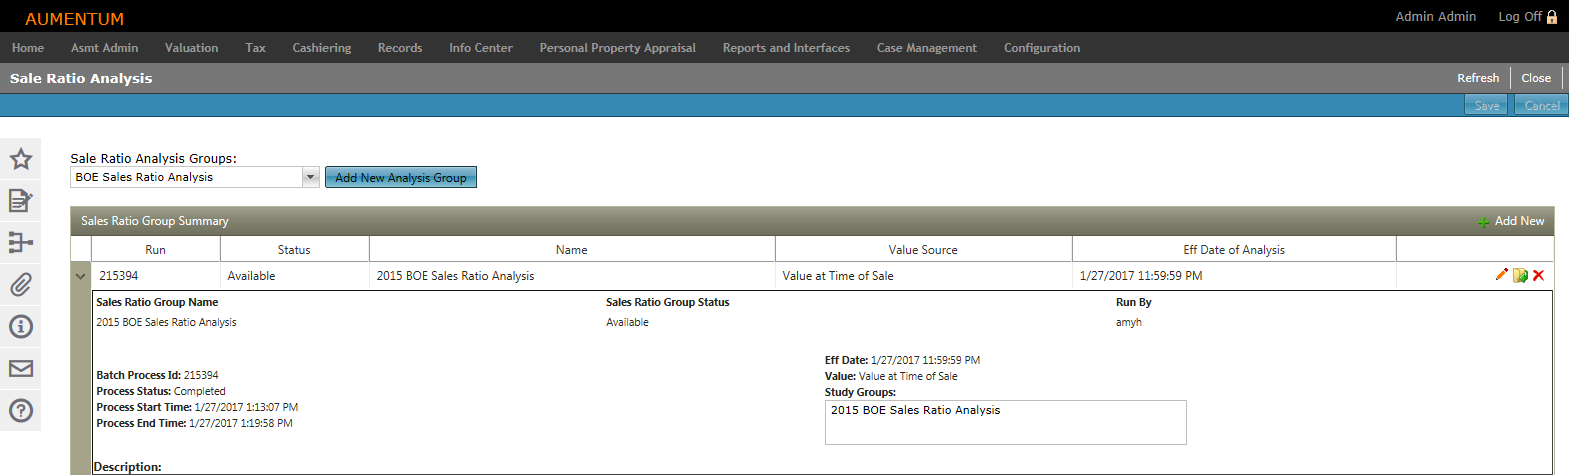
On the Sale Ratio Analysis screen, type a name in the Sale Ratio Analysis Groups field and click the Add New Analysis Group button.
-
On the Sales Ratio Analysis screen, enter or select an effective date.
- Make a selection from the Analysis Group drop-down list.
- Enter or edit the name.
- Make a selection from the Status drop-down list.
- Enter a description for this analysis.
-
In the Study Groups to be used in Sales Ratio Analysis panel, click the chevron to see the group's details.
-
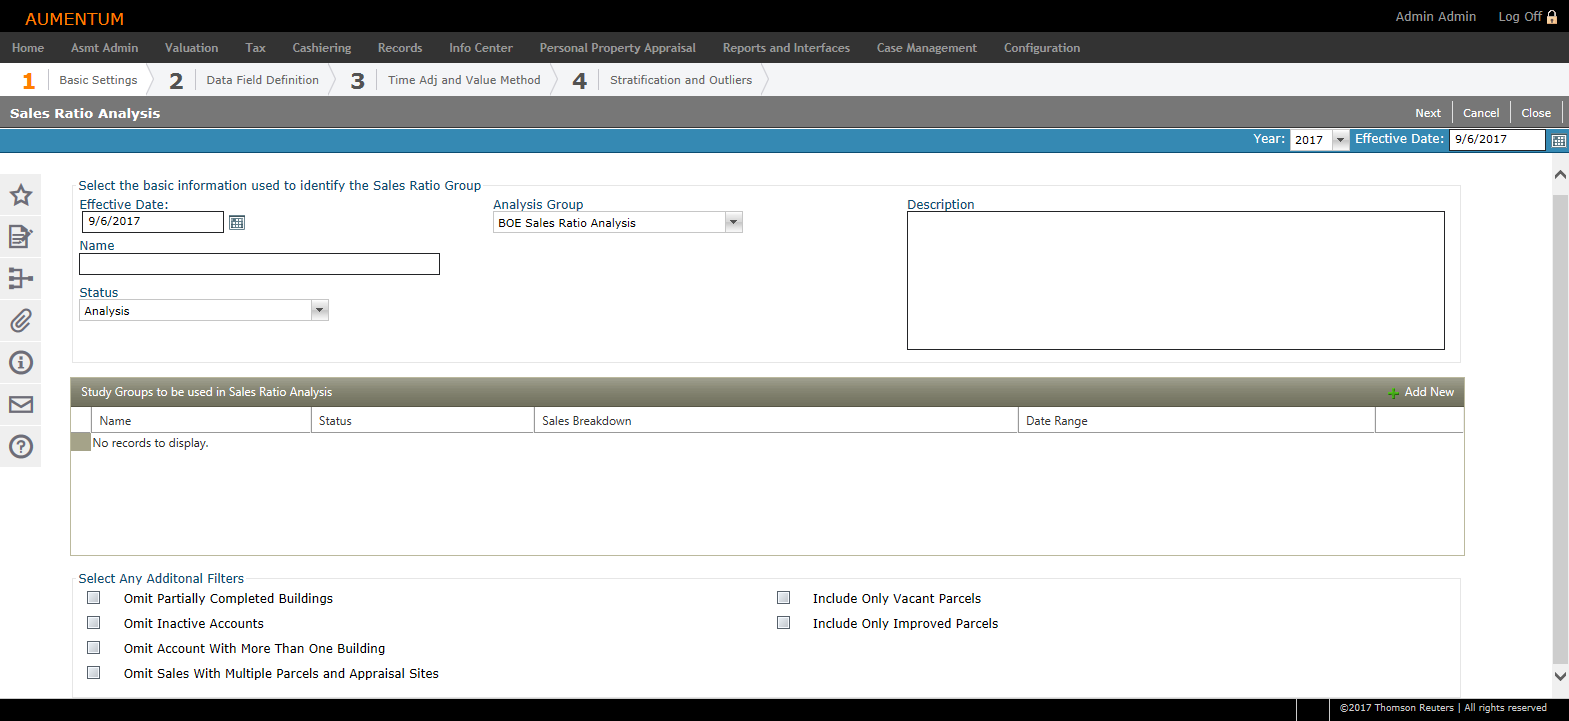
In the Select Any Additional Filters panel, select the checkbox for one or more items, as needed.
-
In the Sales Ratio Group Summary panel, click the folder icon.
- On the Sales Ratio Analysis screen, click Review.
-
Charts – Select the desired chart parameters for visual representation.
-
Trim – Select whether to include the predetermined number of standard deviations, the interquantile range, and the factor number for trim.
-
Detail View – Select whether to include the detail view.
-
Summary – Select whether to include sale details, the number of quantiles, and the whether to include a display chart with the report.
-
Click Apply, or Cancel to close the pop-up without saving changes.
-
Click Export to Excel to open the results in a spreadsheet.
NOTE: Only the fields that you select are exported to the spreadsheet.
-
Click Group Summary to return to the Sale Ratio Analysis screen.
OR
To edit an existing group, make a selection from the Sale Ratio Analysis Groups drop-down list and click the Pencil icon for an item in the Sales Ratio Group Summary panel.
A warning message displays. Click Yes to proceed or Cancel to discontinue the procedure.

There are four tabs in the pop-up:
Adding a Sales Ratio Analysis Group Summary
Follow these steps to create a new sales ratio analysis group summary.
-
Select the desired sales ratio analysis group from the Analysis Group drop-down list.
-
Click Add New in the Sales Ratio Group Summary section to open the New Sales Ratio Analysis Group Options page.
-
Enter the desired basic selections to the selected study group:
-
Select an effective start date in the Effective Date field.
-
Select the analysis group from which to create a new sales ratio group summary in the Analysis Group drop-down list.
-
Enter a unique Name for the new sales ratio analysis group summary.
-
Select the desired status in the Status drop-down list.
-
Add description notes in the Description field.
-
Select a Study Group to be used in the sales ratio analysis.
- Select one of the following status options in the Status drop-down list:
NOTE: The sales ratio analysis group summary feature requires that at least one study group has been created. You may include one or multiple study groups by clicking the green check located on the row of the applicable study group. Selecting the Remove icon will simply remove the study group association; it will not delete the study group from the system.
Optionally, select the Expand > button to review any additional details about the group.
-
New
-
Available – An analysis is available for study
-
Pending – An analysis has been defined and has been scheduled to run at a future time
-
Analysis
-
Locked – An analysis has been completed and may be viewed but is no longer available for editing
-
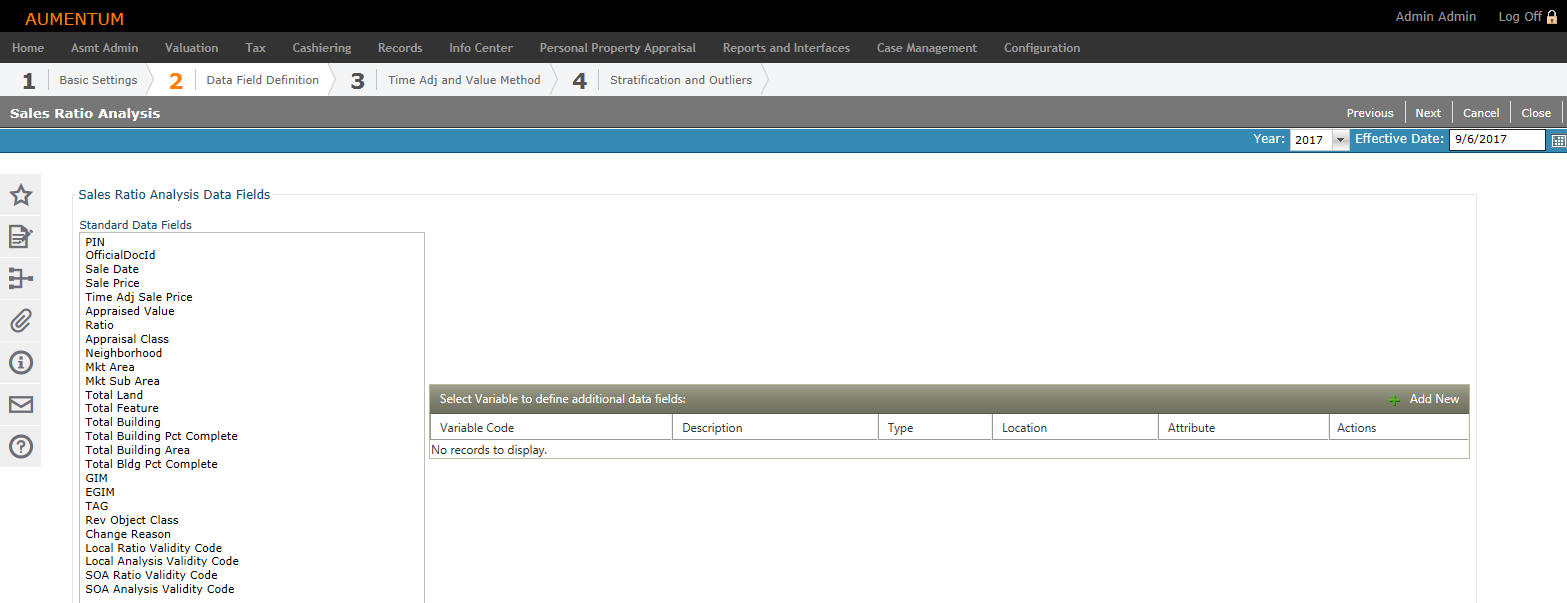
Click Next to define Data Fields and Variables. The Standard Data Fields panel on the left lists the standard data fields which are already included.
-
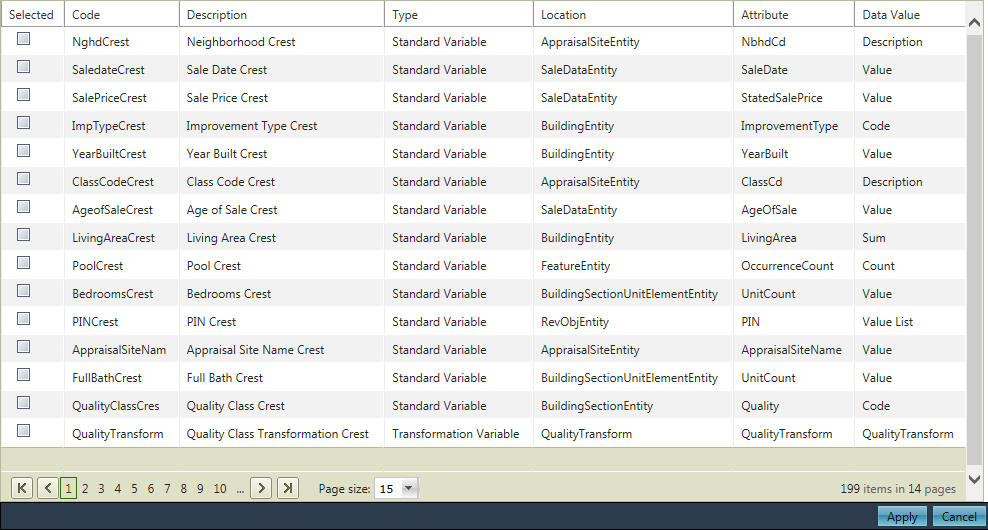
Click Add New in the Select Variable grid to defined additional Data Fields in the Variables Selection pop-up.
-
Select one or more variables to include and click Apply. Click Cancel to cancel the add.
-
Click the Red X on any existing row to remove it from the list.
-
Click Next to continue and add a time adjustment and value method.
-
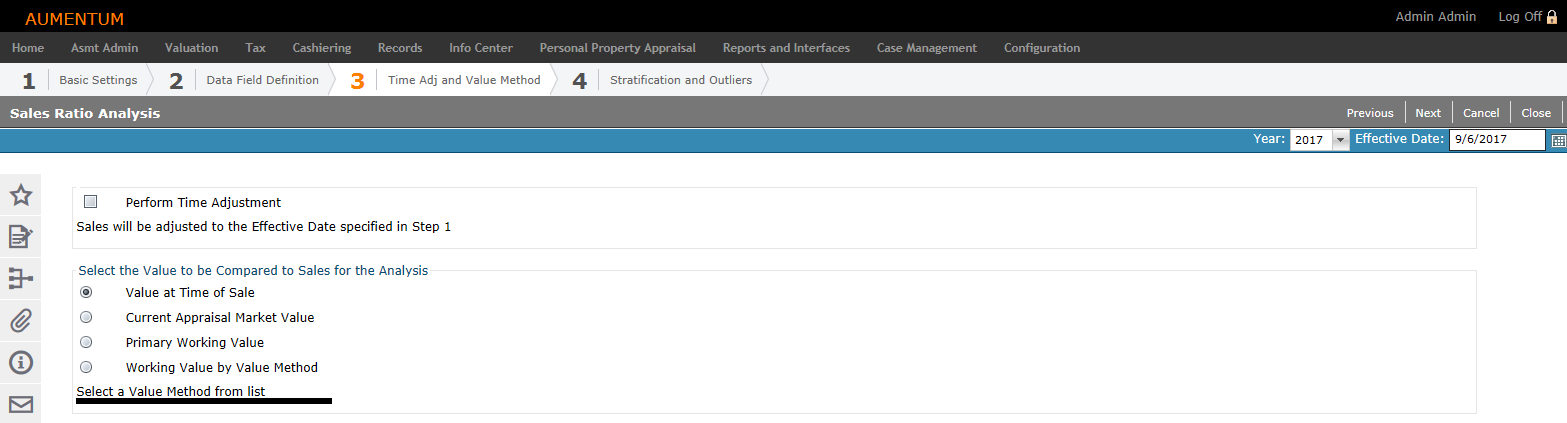
Optionally select to Perform a Time Adjustment.
-
Select the Perform Time Adjustment checkbox to perform an adjustment.
-
Select the Value to be Compared.
-
Value at Time of Sale - Value recorded on record at date of sale.
-
Current Appraised Market Value - the most current saved, concluded value on record.
-
Primary Working Value
-
Working Value by Value - Select a Value Method from the List (not pictured).
-
Select a Value Method from the list. Use the tree expand plus (+) button to view the options for each, Income, Cost, and Comps, and select the applicable method.
-
Click Next to open the Stratification and Outliers page.
-
Select the Primary Strata Level.
-
Select the Secondary Strata Level.
-
Appraisal Site Class Group
-
Market Area
-
Market Sub Area
-
Neighborhood
-
Revenue Object Class Code
-
Tax Authority Group
-
Enter the Optional Quantile Setting. Quantiles allow you to break statistical results within a group into equal segments resulting in more refined statistical analysis.
-
Select the Upper and Lower Trim Ratio for Outliers.
-
Select how to Schedule the Batch Process.
-
Click Finish to complete the setup and initiate the statistical calculations. You advance automatically to the Info Center > Batch Processes screen to view the batch process.
Time adjustment refers to the price adjustment for the effects of price changes reflected in the market between the date of sale and the date of analysis. The adjustment calculations will assume the effective date for adjustments to be the date specified in basic settings. The value methods include three predefined options and an dynamic value method option based upon the records identified to be included in the analysis. Only one method may be selected.
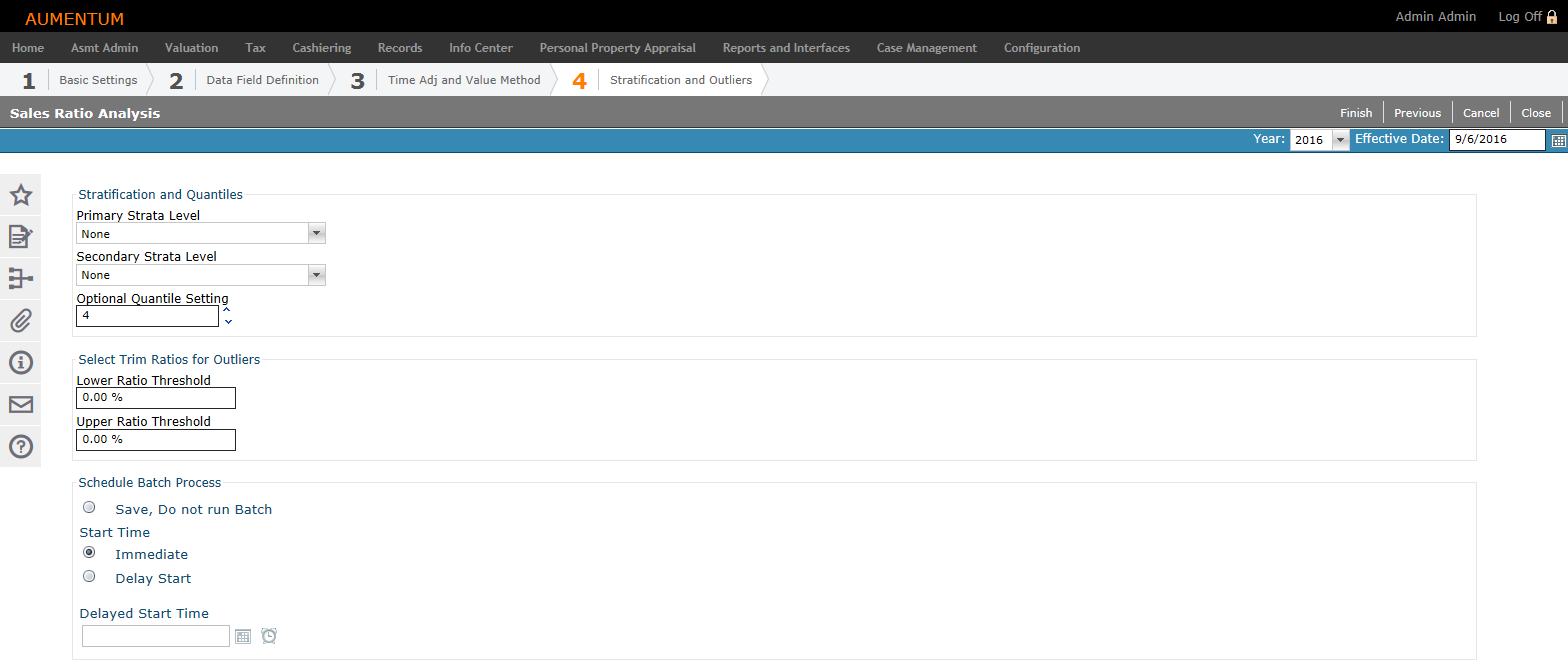
You may select a primary and a secondary grouping order from drop-down lists. For example, you could choose to group by Tax Authority and Neighborhood. You can set Tax Authority as the primary group and neighborhood as the secondary group. While overall statistics can be viewed during the analysis, statistics are also available based on the grouping selections (i.e., selecting Tax Authority as primary and Neighborhood as secondary), statistical information is grouped by TAG first; next, associated neighborhoods are grouped with statistics returned on each Tax Authority (TAG 10, TAG 11, etc.) as well on each of the Neighborhoods.
Outliers are defined as data points (sales) that are distinctly separate from the rest of the data. In a sales analysis, they are ratios that are very high or very low. In an analysis of sales data, outliers can increase error variance and have a negative influence on the results. An important functionality provided by the sales ratio analysis is to make available a means to remove or trim outliers from the analysis. The High/Low method of trim provides you with a means to identify outliers by using a low and high percentage cutoff by excluding any ratios falling below the low cutoff percentage or above the high cutoff percentage from the ratio study. The resulting report statistical calculations will exclude any ratio falling below the low percentage entry or above the high percentage entry. The identified sales/outliers data will be stored as a separate group and will remain available throughout the ratio report functionality.
Exporting an Existing Study Group
-
Select the desired study group from the Sales Ratio Analysis Groups drop-down list.
-
Click the export icon to open the sales ratio summary page.
-
Click Export to Excel to open the sales ratio summary statistics as an Excel spreadsheet document which includes a section for Income Rates. Three separate Excel tabs are included in this document:
-
Summary Page Quantiles which includes Gross Rent Multiplier details
-
Primary Order
-
Record Detail
-
Click Previous to return to the previous step.
-
Click Cancel to cancel out of the Sales Ratio Analysis task.