Neighborhood Analysis
Navigate:  Valuation >
Analysis > Neighborhood
Analysis
Valuation >
Analysis > Neighborhood
Analysis
Description
Use Neighborhood Analysis to analyze sales information by: neighborhood for sale count, parcel count (for the neighborhood), high/low sales price, median sales price, mean sales price, high/low value, median value, mean value, mean ratio, weighted mean ratio, coefficient of variance, coefficient of dispersion, price related differential, standard deviation, and average absolute deviation. These statistics can be helpful information for you to determine what areas may need field inspections or other advanced analysis. These statistics are used to determine which areas. need field inspections or further analysis.
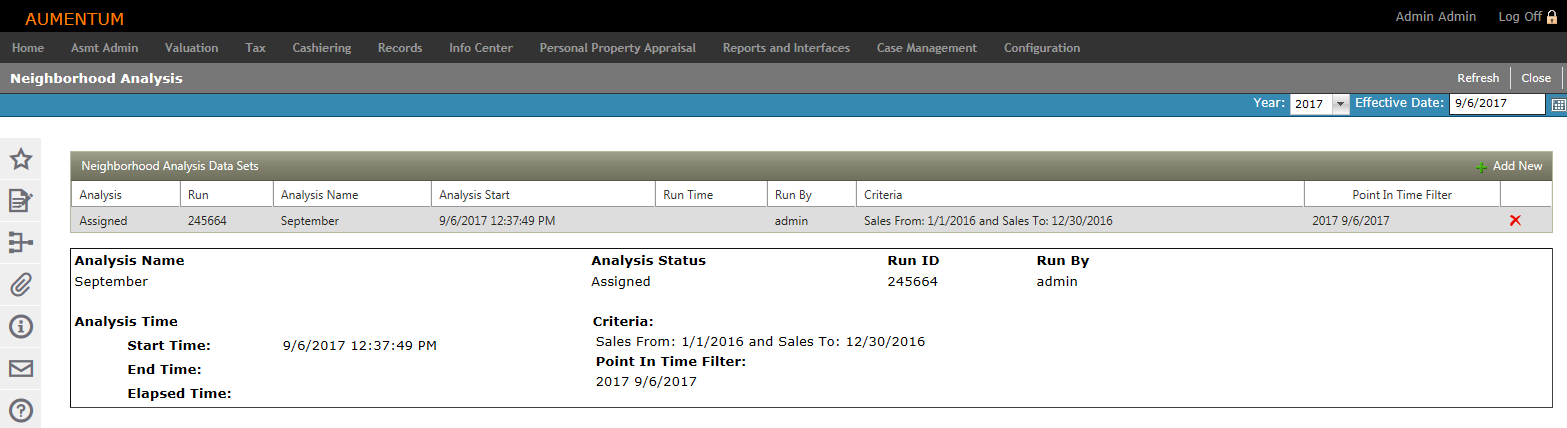
The Neighborhood Analysis screen lists all of the existing data sets for neighborhood analysis that have been previously created.
NOTE: The current Year and Effective Date are displayed and set by default but you can change these if you have the applicable user role privilege by selecting the Year and Effective Date. User privileges are typically set by your system administration via Configuration > Security and User Maintenance > Roles. After selecting any Year or Effective Date, click Refresh to refresh the data.
Steps
-
Click to select a data set in the Neighborhood Analysis Data Sets grid to display its details below.
-
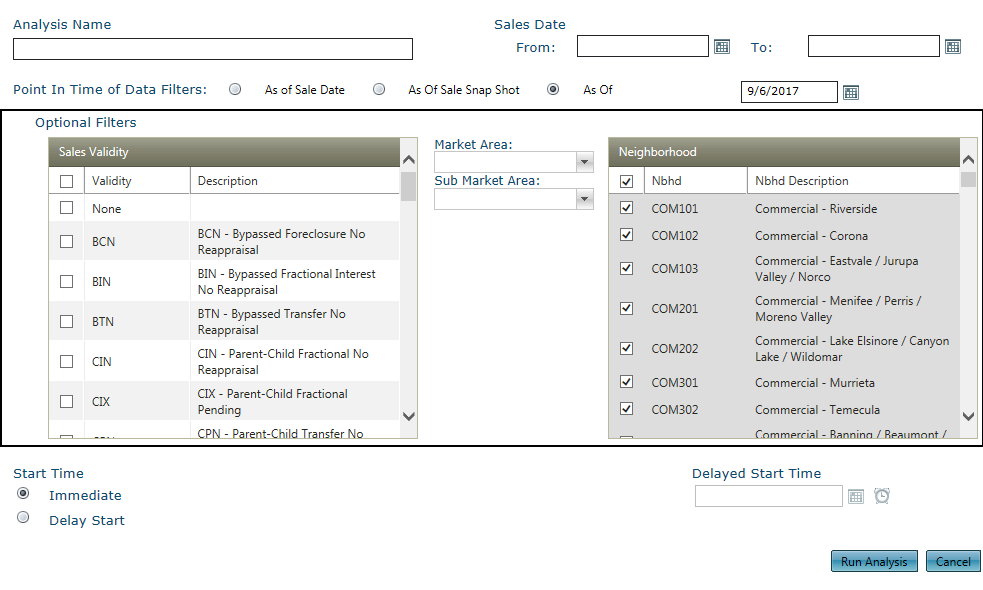
Click Add New to add a new Neighborhood Analysis Data Set. The Add New Neighborhood Analysis pop-up displays to define the analysis.
-
Define the neighborhood analysis and click Run Analysis.
-
-
Click the microscope in any row to view details on the Neighborhood Analysis Detail screen.
-
Click Refresh to clear all selections and refresh the page.
-
Click Close to end the task.