Management Console
Navigate:  Cashiering > Management Console
Description
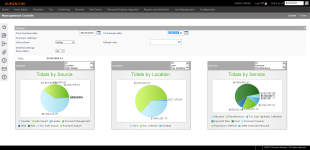
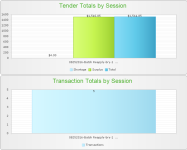
This management tool gives a visual representation of the activities of a business day. View the breakdown of the day's collections by source, location, and service in a pie chart. You can also view a bar graph of tender details by session for a selected location or till. You can check throughout a day to see the progress being made, or review previous work and totals.
SETUP: See Cashiering and Cashiering Setup for any applicable prerequisites, dependencies and setup information for this task.
Steps
-
Select a From business date and To business date range.
-
Choose dollar or percentage as the Value shown; switch back and forth as needed.
-
Enter the Refresh rate in minutes for the interval at which the display will automatically update. At any time you can click Update for an instant refresh of the information.
-
Select Yes if you want to Show detail or No to only see the summary. The detail consists of a bar graph that displays below or to the right of the pie charts. Additional choices are available for the bar charte:
-
Choose the Selection type of Till or Location.
-
From the list of tills or locations, select your choice and click Look Up.
-
Choose a Session. to view a bar graph of the tender totals by session.
-
On the pie charts, you can select Sources, Locations, and Services, and click Update. The graphical displays are updated according to your choices. For example, choose the source Counter for all locations for real property.
When viewing all, you will see the breakdown by percent or dollar amount. -
Click Close to exit the screen.
Tips
You may need to scroll down to view the bar graphs, depending on your screen size and resolution.

