Risk Dashboard
Navigate:  Case Management
> Risk Exposure
Case Management
> Risk Exposure
Description
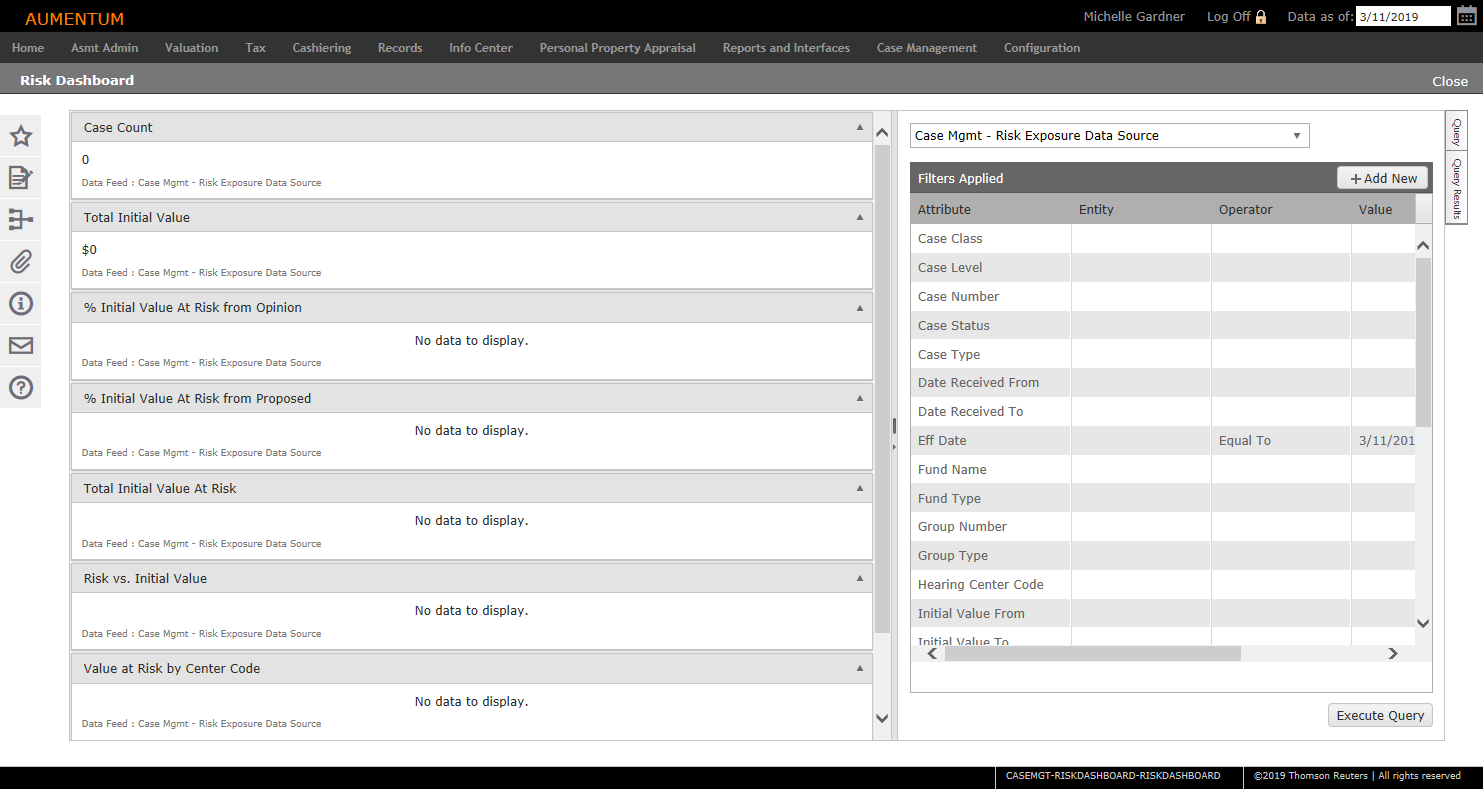
Use the Risk Dashboard to calculate the risk exposure to the tax revenue based on open appeals, including the total exposure and exposure by fund, Tax Rate Area, or year.
The Risk Dashboard displays an overview of the risk analysis (from open appeals) to assess if there is available revenue for refunds. In addition, a Risk Exposure report can be generated for availability to interested parties.
NOTE: By default, the Risk Dashboard displays case information for hearings scheduled to be heard on the current day. If no cases are scheduled for today's date, the Risk Dashboard is blank.
Steps
-
On the Risk Dashboard screen, click the Query tab on the right side of the screen to define filtering constraints on open case data that is returned in the Risk Dashboard. Creating filters identifies which open appeal/group of open appeals are evaluated for calculating risk exposure.
-
Add new filters to the search parameters, as desired.
-
Click Execute Query. The analysis information is displayed for the items specified in the Filters Applied panel.
-
View the analysis information.
-
Case Count – The number of cases in the query results.
-
Total Initial Value – The sum of the initial values for the cases in the query results.
-
% Initial Value At Risk From Opinion – The difference of Initial value minus Opinion as a percentage of the total Initial value for the cases in the query results.
-
% Initial Value At Risk From Proposed – The difference of Initial Value minus Proposed, as a percentage of the total Initial value for the cases in the query results. If a Proposed value has not been made, the application substitutes the initial value for the proposed value.
-
Total Initial Value At Risk – This value is calculated by using the largest percentage from % Initial Value at Risk From Opinion, or from % Initial Value At Risk From Proposed (whichever is considered the worst case scenario), and multiplying by the Total Initial Value.
-
Risk vs. Initial Value – Displays a scatter plot of Initial Value versus Risk for the open cases being analyzed.
-
Value at Risk by Center Code – Displays a pie chart of open cases by center code value. Hover your cursor over the pie chart to display more information.
-
Value at Risk by Case Type – Displays a pie chart of open cases by case type.
-
Click to expand the Query Results tab to view all of the cases pulled for the risk analysis.
-
Click Export to Excel to open the query results in a spreadsheet.
-
Click Print to print the query results.
-
Click Close to end the task.
NOTE: Click the pushpin icon to pin the Query flyout to the window panel to observe changes in the dashboard information as the query results change.
Tips
The information displayed on the Risk Dashboard, and in the Risk Dashboard report can also be found by navigating to Tax > Levy Management > Tax Rate Maintenance > Tax Rates by TAG. The Tax Rates by TAG information can be used to develop the Risk Exposure to be reported when tax rates and apportionment factors amongst tax authority funds are used to distribute dollars.