Queue Management Dashboard
Navigate:  Case Management
> Queue Management > Queue
Management Dashboard
Case Management
> Queue Management > Queue
Management Dashboard
Description
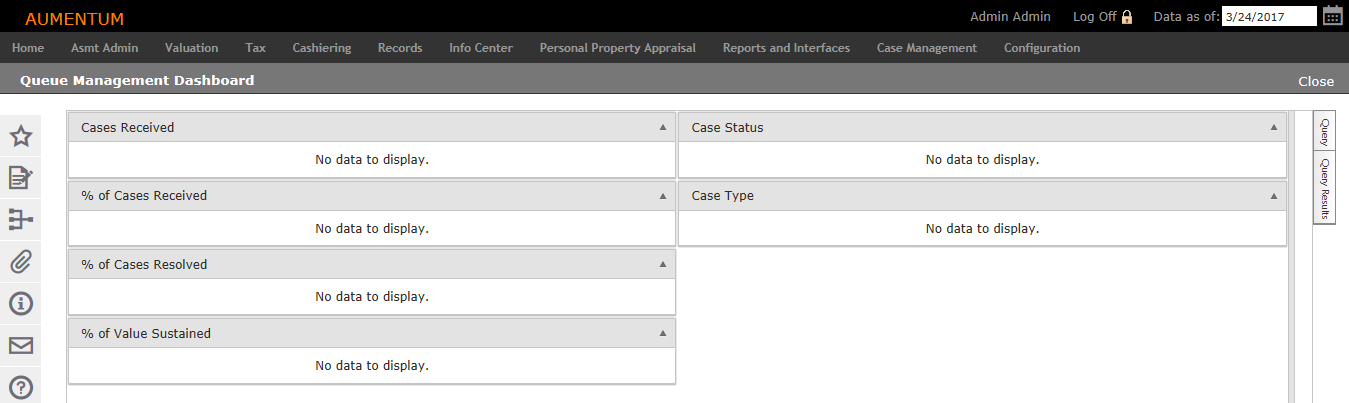
The Queue Management Dashboard allows you to oversee/track daily hearing processes as they take place and monitor case sets and cases in a broad range of appeals scheduled for hearings. The dashboard allows you to:
-
Determine which appraisers/resources are participating in which cases so adjustments can be made, if needed.
-
Compare the hearing schedule with the actual hearing times to make adjustments as needed.
NOTE: By default, the Queue Management Dashboard displays case information for hearings scheduled to be heard on the current day and time. If no hearings are scheduled for the current/selected day, the dashboard is blank. Use the Query flyout to filter results to provide updated case metrics for the desired date and time.
Steps
-
Click to expand the Query menu to define the filters to be applied to the search criteria to display the hearings in queue. Only cases that have been scheduled for hearings are returned in the Query Results.
-
Add New filters to the search parameters, as desired.
-
Click Execute Query. The hearing information is displayed for the Filters Applied.
-
View the Queue Management Dashboard information.
-
Cases Received – Displays a pie chart depicting all of the appeal cases scheduled, by category.
-
Checked In – Cases that have been scheduled and the participants are present.
-
Stand by – Cases that have not been scheduled and the participants are present.
-
No Show – Cases that are not checked in and are late for their scheduled time.
-
In Queue – Cases that are not checked in and are not late for their scheduled time.
-
% of Cases Received – Displays progression bar of the percent of cases that have been received; this includes cases where participants are present, checked in and on stand by.
-
% of Cases Resolved – Displays a progression bar of the percent of cases that have been resolved, that may potentially be Received.
-
% of Value Sustained – Displays a progression bar of the percent of cases resolved of those heard for the current day (values sustained).
-
Case Status – Displays a pie chart depicting all of the appeal cases scheduled by the status of the case.
-
Case Type – Displays a pie chart depicting all of the appeal cases scheduled, by Case Class, Level and Type.
-
Click to expand the Query Results tab to view all of the cases pulled from the Query.
-
Click the Export to Excel icon to Export the Query Results to a Microsoft Excel Worksheet.
-
Click the Printer icon to Print the Query Results.
-
Click Close to end the task.
NOTE: Click the pushpin icon to pin the Query flyout to the window panel to observe changes in the dashboard information as the Query Results change.
NOTE: Optionally (de)select groups to include in the export/printout.